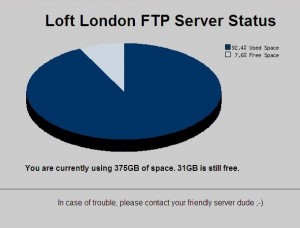
I’m managing a server for Loft London. They’re using it as FTP site for various clients, so I wanted to provide an easy way for them to keep an eye on how much space is used and how much is left.
I’ve done some digging and found this super handy PHP Pie Chart generator by Rasmus Peters. You can call it just like an image, give it some parameters and generate a very cool pie chart diagramme.
My challenge was to use it dynamically by calling the df command on th ecommand line and convert that into a pie chart. Here’s how I did it:
Here’s the code you need
First, save the code on Rasmus’ site as a file called piechart.php and save it in the same directory as the file you’d like to call it from.
Then use this code to read the actual free disk space from your partition (in my case dev6) and split the string into the values you want to use. Save this as a .php file:
<?php
$input = "df -h /dev/hda6";
$output = shell_exec($input);
// echo $output;
 $pieces = explode(' ',$output);

// print_r($pieces);

$chopped = (int)(substr($pieces[33],0,-1)/4.06);

?>
Then you can call the piechart file with your values just like an image:
<img src="http://yourdomain.com/piechart.php?data=

<?php echo $chopped . '*' . (100-$chopped); ?>&label=Used Space*Free Space" />
The Code Explained
The first two statement give the actual linux command to the shell ($input) and reads its answer ($output). df -h reads the free disk space in Linux, and /dev/hda6 specifies the partition we’re interested in. You can use echo $output to see how it looks.
Then we’ll create an array ($pieces) of the output from this command using the explode() function. You can use the print_r() function to see the contents of this array – that way you can pick the value you’re after.
In my case the “used space” is in $pieces[33] – however it’s displayed with a “G” at the end (as in 100G). What we need is a number, so we’re using the substr() function to chop off the last digit.
I’m giving my client 406GB of space with a hard clip on the server, so our “free space” is therefore 406 minus the “used space”. In $chopped we’re generating this and divide it by 406 to get a percentage value.
When we call the piechart using the <img src… > statement, we’re giving it the following values:
- used space
- a seperator (*)
- free space (i.e. 100-$chopped)
- and two labels (Used Space and Free Space)
The script converts all this into a convenient .jpg image which is sent back to the browser.
v 1.1 Update – 08/11/2010
I found that in some cases the used space can be greater than the assigned value. That confuses the pie chart because we’ll end up with values larger than 100%. To avoid this, we’ll have to test both $chopped and $freespace variables for such cases and put them in their right place. I’ve made the following amendmends to the code:
if ($chopped > 100) {
$chopped = 100;
}
$freespace = 406 - substr($pieces[33],0,-1);
if ($freespace < 0) {
$freespace = 0;
}

nice tutorial. it really helps.thanks
😉